EV Adoption Rate in the USA 2025: Growth, Trends, and Future Outlook
The EV adoption rate in the USA in 2025 marks a major milestone for the automotive industry. After years of steady growth, electric vehicles have shifted from early-adopter curiosity to a mainstream choice for millions of Americans. With stronger government policies, expanding charging networks, and growing environmental awareness, 2025 is shaping up to be one of the most transformative years for EV expansion in the United States.
What Is the EV Adoption Rate?
The EV adoption rate measures how quickly consumers transition from gasoline-powered vehicles to electric alternatives. It is commonly calculated as:
EV Adoption Rate Formula
It can also reflect the percentage of EVs currently on the road compared to all passenger vehicles.
Tracking this metric helps policymakers, automakers, and investors understand the nation’s progress toward cleaner transportation.
EV Adoption Trends in the USA (2025 Overview)
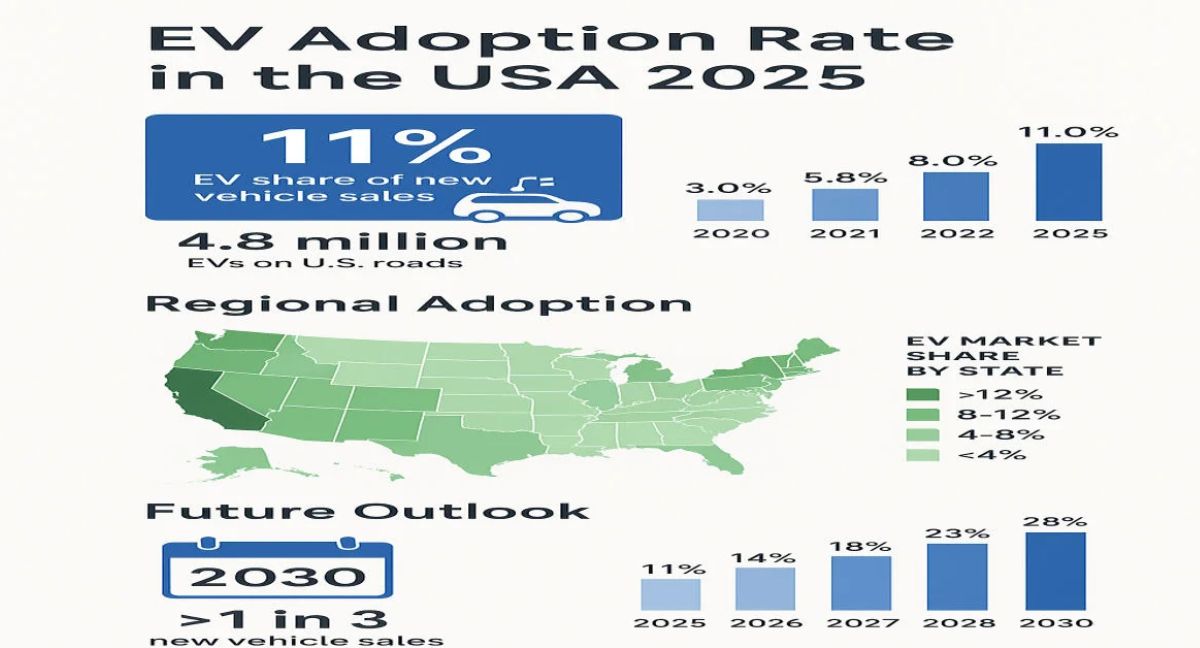
By mid-2025, the EV sector has achieved major growth milestones, supported by improved affordability and advancements in charging infrastructure.
Table 1: EV Market Snapshot — United States, 2025
| Metric | Data (2025) | Source |
|---|---|---|
| EV Share of New Vehicle Sales | 10.2% – 11.5% | IEA, JD Power |
| Total EVs on U.S. Roads | 4.8 million+ | DOE AFDC |
| EV Sales in 2024 | 1.6 million units | IEA EV Outlook |
| DC Fast Chargers Nationwide | 55,000+ | U.S. DOE |
| Average EV Price (after incentives) | $42,000 | Kelley Blue Book |
These numbers show that EVs are rapidly moving into the mainstream, making 2025 a pivotal year for national adoption.
State-by-State Adoption: Where EVs Are Growing Fastest
EV adoption varies widely across the country. States with strong incentives, renewable energy goals, and dense charging networks lead the transition.
Table 2: Top 10 States by EV Market Share (2025)
| Rank | State | Market Share | Key Drivers |
|---|---|---|---|
| 1 | California | 25% | ZEV mandate, generous incentives |
| 2 | Washington | 18% | Clean energy policies |
| 3 | Oregon | 16% | Extensive charging network |
| 4 | New York | 12% | Rebates + urban fleet adoption |
| 5 | Colorado | 11% | State tax credits |
| 6 | Texas | 9% | Fleet electrification |
| 7 | Florida | 8% | High infrastructure growth |
| 8 | Illinois | 7% | EV manufacturing presence |
| 9 | Massachusetts | 6% | Clean-energy targets |
| 10 | Arizona | 6% | Solar-based charging options |
California continues to dominate, accounting for nearly one-third of all U.S. EV sales.
Federal Policies Boosting EV Adoption in 2025
Federal support remains one of the biggest accelerators of EV adoption in the U.S.
Key Federal Incentives in 2025
-
Clean Vehicle Tax Credit: $3,750–$7,500 for qualifying new EVs
-
Used EV Credit: Up to $4,000 for used EVs priced under $25,000
-
Charging Infrastructure Credit: Up to 30% reimbursement for home or commercial chargers
-
Federal Fleet Electrification: Government fleets transitioning fully electric by 2035
These programs are improving affordability, expanding U.S. EV manufacturing, and creating thousands of clean-energy jobs.
What Drives Americans to Choose EVs?
Even with incentives, several personal and economic motivations influence consumer decisions.
A. Economic Advantages
-
Fuel savings: $1,000–$1,200 annually
-
Lower maintenance: 30–40% cheaper than gasoline vehicles
-
Long battery warranties: Usually 8–10 years
B. Environmental Motivation
Each EV reduces up to 4.6 metric tons of CO₂ emissions annually compared to a gas vehicle.
C. Technology Appeal
EVs attract buyers with:
-
Quick acceleration and instant torque
-
Advanced infotainment systems
-
Over-the-air updates
-
Driver-assistance features
D. Charging Availability
Around 80% of EV owners charge at home, while public charging is expanding rapidly in urban areas.
Automaker Commitments Accelerating Adoption
Major automakers are rapidly electrifying their vehicle lineups in 2025.
Table 3: Automaker EV Goals and Key 2025 Models
| Automaker | EV Goal | Popular 2025 EVs |
|---|---|---|
| Tesla | 100% electric lineup | Model Y, Cybertruck, Model 3 |
| Ford | 50% EV sales by 2030 | Mach-E, F-150 Lightning |
| GM | 100% zero-emission by 2035 | Equinox EV, Silverado EV |
| Hyundai | 7 EVs by 2028 | Ioniq 5, Ioniq 6 |
| Toyota | 1M EVs/year by 2030 | bZ4X, solid-state EVs |
| Rivian | Expanding capacity | R1T, R1S |
| Volkswagen | 70 EVs by 2030 | ID.4, ID.7 |
These commitments increase competition, innovation, and price reductions across the market.
Charging Infrastructure: The Backbone of EV Growth
The United States now has one of the fastest-growing charging networks worldwide.
Table 4: U.S. Charging Infrastructure (2025)
| Charging Type | Speed | Number of Stations | Coverage |
|---|---|---|---|
| Level 2 (AC) | 4–6 hours | 80,000+ | Nationwide |
| DC Fast Charging | 20–40 mins | 55,000+ ports | Interstate corridors |
| Tesla Superchargers | Up to 250 kW | 20,000+ ports | Nationwide |
| Workplace Charging | Varies | 10,000+ | Offices, malls |
The NEVI Program requires chargers every 50 miles along major U.S. highways, making long-distance EV travel easier than ever.
Barriers Slowing EV Adoption in 2025
While adoption is growing, several challenges remain:
A. Upfront Prices
EVs can still cost more upfront than gas vehicles, though prices continue decreasing as battery costs fall.
B. Charging Access
Rural and apartment-dwelling consumers still face fewer charging options.
C. Battery Materials
Lithium, nickel, and cobalt supply chains remain under pressure, though U.S. recycling companies like Redwood Materials are expanding capacity.
D. Consumer Education
Some drivers still have concerns about range, cost, and long-term battery performance.
Forecast: What’s Next for the U.S. EV Market?
Industry forecasts point to strong growth in the next decade.
Table 5: U.S. EV Growth Forecast (2025–2035)
| Year | EV Market Share | EVs on Road | Source |
|---|---|---|---|
| 2025 | 10–12% | ~5M | IEA |
| 2026 | 14% | 6.5M | BNEF |
| 2027 | 18% | 8M | Statista |
| 2030 | 28–30% | 14M+ | DOE |
| 2035 | 50%+ | 25M+ | EPA |
By 2030, one in three new vehicles sold in the U.S. is expected to be electric.
Economic & Environmental Impact
Economic Benefits
-
250,000+ new jobs in EV manufacturing and battery production
-
Lower national fuel spending (projected $200 billion savings by 2035)
-
Growing domestic supply chain for semiconductors and batteries
Environmental Benefits
-
Up to 500 million metric tons of CO₂ reduction annually by 2030
-
Lower oil imports
-
Healthier air quality in urban areas
Consumer Tips: How to Transition to an EV in 2025
Here are practical recommendations for new EV shoppers:
-
Verify federal & state incentives
-
Check your home charging options
-
Compare long-term costs, including maintenance and fuel
-
Select an EV with sufficient range for daily use
-
Consider a certified used EV
-
Review battery warranty details
Expert Insights on U.S. EV Adoption
“We are moving from early adopters to the early majority. 2025 represents the true turning point.”
— Alliance for Automotive Innovation
“Charging infrastructure is enabling cross-country electric travel like never before.”
— U.S. Department of Energy
“Urban areas will reach mass adoption first, with nationwide growth accelerating by 2030.”
— BloombergNEF
Conclusion: 2025 Marks the Transition to Mainstream EV Adoption
The EV adoption rate in the USA in 2025 confirms a nationwide shift toward sustainable transportation. With more than 10% of new car buyers choosing electric vehicles, the country is closer than ever to a clean-energy future.
While challenges remain—such as charging access and upfront costs—the combination of federal policies, automaker commitments, and consumer awareness is pushing EV adoption to new heights. The momentum built in 2025 will set the pace for an even more electrified decade ahead.
1 thought on “EV Adoption Rate in the USA 2025”